Some say that “statistics mean nothing to the individual”. Sure, one could argue that statistics may not necessarily apply to specific people, but they still, nevertheless, explain our reality—the likelihood and possibility of certain circumstances and situations to happen given the number of cases over an average arbitrary measure.
Data Is Beautiful (r/dataisbeautiful), a significantly large subreddit (a subsection) of the forum-like social media Reddit, is dedicated to celebrating the various bits and pieces of information in the form of graphs and charts. One of the more recent posts to find itself here is an interesting graph showing the most and least common birthdays in the United States.
Ever noticed how there are more birthdays happening in the summer than in any other season?
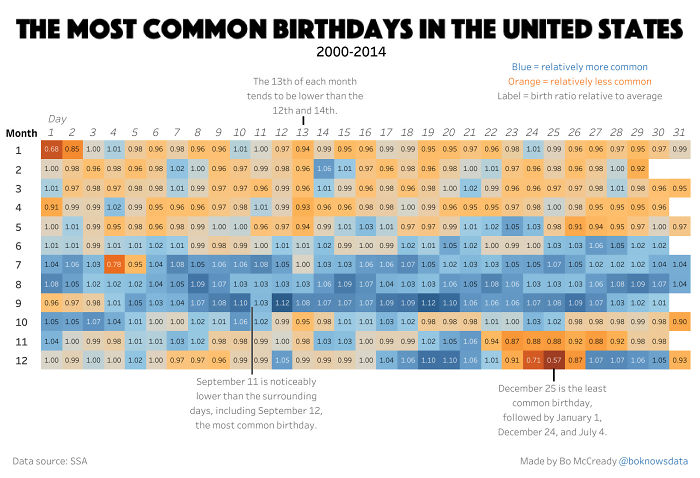
Image credits: Bo McCready / SSA
The graph is divided up into individual days and months of the year, covering a span of 14 years between 2000 and 2014. Each day is color-coded using varying shades of blue, orange or gray. Blue means that a particular day has more births than usual, while the orange means it has less. Gray indicates that it’s relative to the average.
The numbers provided in each block indicate the margin by which the birth rate exceeds or falls short of the average, which is equal to 1. Anything under a 1 means that it’s not a popular birthday, while anything over that number means it’s common.
A Redditor recently compiled a beautiful graph showcasing the most and least common birthdays
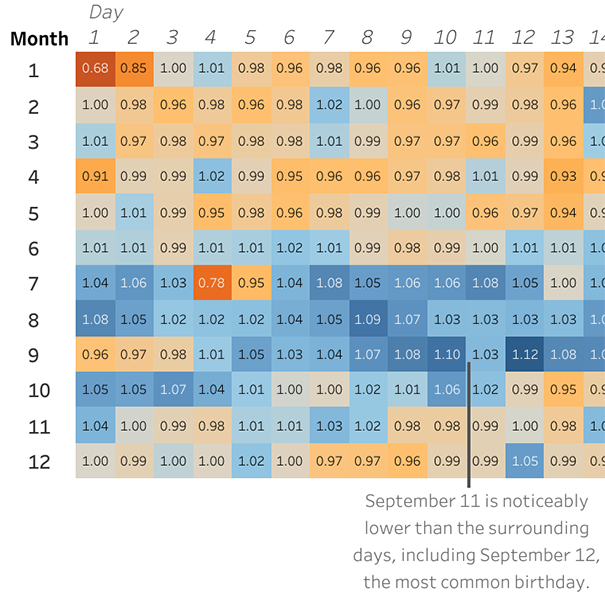
Image credits: Bo McCready / SSA
According to this data, which is based on information made public by the Social Security Administration of the United States, “birthday season” starts sometime in June and ends in October. For the years 2000–2014, the most common birthdays were in September, namely the 12th and the 19th.
Fun fact, for the longest time, September 9th used to be the most popular birthday, but the 12th and the 19th were always hot on its heels. It is speculated that September is the most popular month for birthdays due to the fact that holiday season is 40 weeks prior to this, and, statistically speaking, more couples have sex during vacation time.
Turns out, summer is birthday season with September being the most popular month in that regard

Image credits: cobaltfish
This is paired up with a theory proposed by researchers at the University of Texas School of Medicine back in 2001 stating that there is reason to believe that winter is a more suitable time for reproduction due to the changes in daylight length, the variation in quality of the reproductive functions, and whatnot.
The least popular day is, however, Christmas (December 25th), followed by New Year’s (January 1st), Christmas Eve (December 24th), and surprisingly the US’ Day of Independence (July 4th).
The least common days are Christmas, Christmas Eve, New Year’s, and, surprisingly, 4th of July
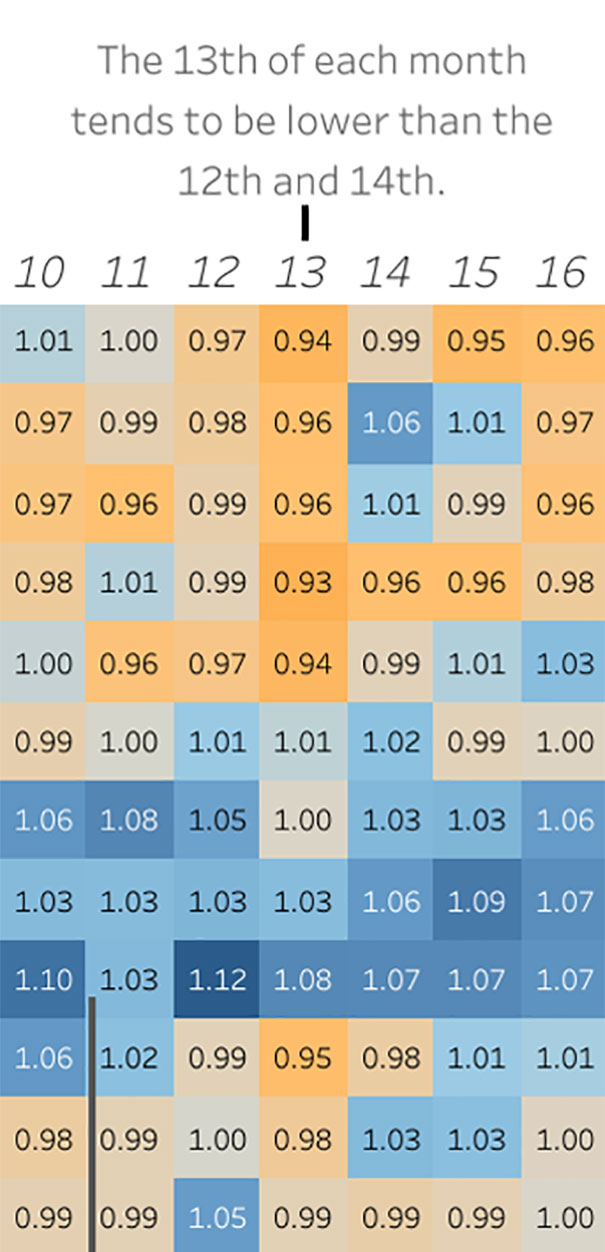
Image credits: Bo McCready / SSA
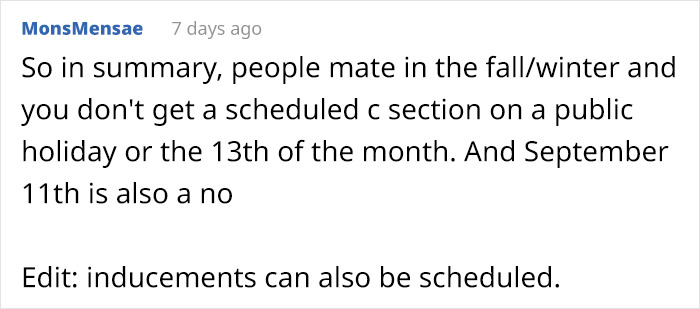
Now, it’s quite sensible to say that you don’t really choose when to give birth—the body and the baby sort of decide the specifics, so it’s interesting to see these particular days, even within “the season”, to be the least common. It is also interesting to see how the 13th of each month is noticeably less popular than the adjacent days.
Another graph, also found on Reddit, covers a different time span, namely the ten years between 1994 and 2003, but shows pretty much the same results: birthing season is mid to end summer and September is still king.
It also points out that the 13th day of each month is often noticeably less common compared to adjacent days
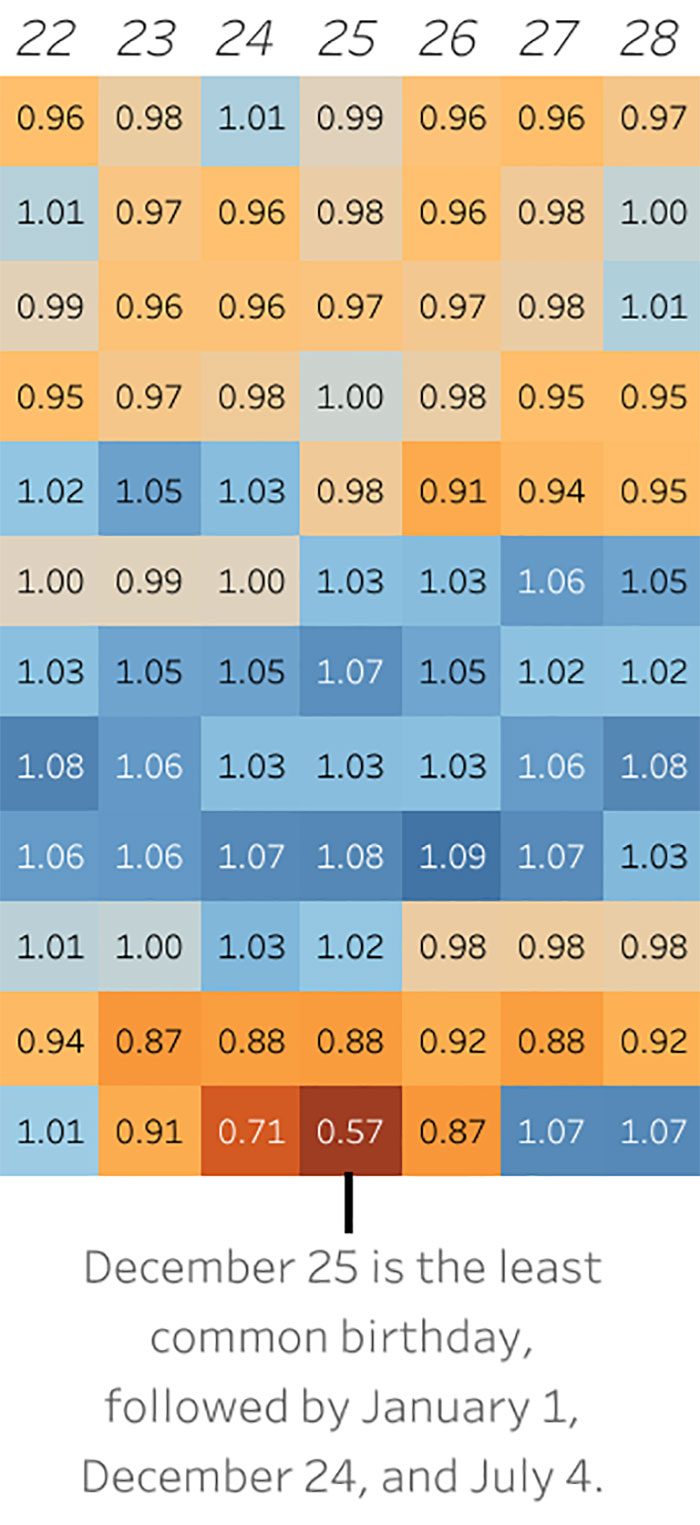
Image credits: Bo McCready / SSA
It also gives other fun tidbits of information, like the most popular significant dates as birthdays being Valentine’s Day (February 14th), Friday 13th, and April 20th, a significant date in cannabis culture. The most popular day of the week is Tuesday, followed by Thursday, Wednesday, and Friday with the least popular being Sunday.
A similar trend can be found on a global scale, as seen in this graph by Visme. In much of the world, September stays the most popular month for birthdays, though the birthday season is slightly pushed towards winter season in countries within the tropical zone, and towards spring in the south temperate zone.
So, what are your thoughts on this? Were you born during the time when it’s cool to be born, or are you happy that your birthday is more personal as less people were born on it? Let us know in the comments section below!
Here’s how people reacted to these findings


from Bored Panda https://ift.tt/31dTXi2

